The Builder (Studio)
Studio is where workflows are made: a canvas-first editor embedded in the Nucleus, with the node library on the left, your graph in the middle, and every step’s settings edited on the node itself. Everything in this guide was captured from a live Flowdrome — what you see here is what you get.
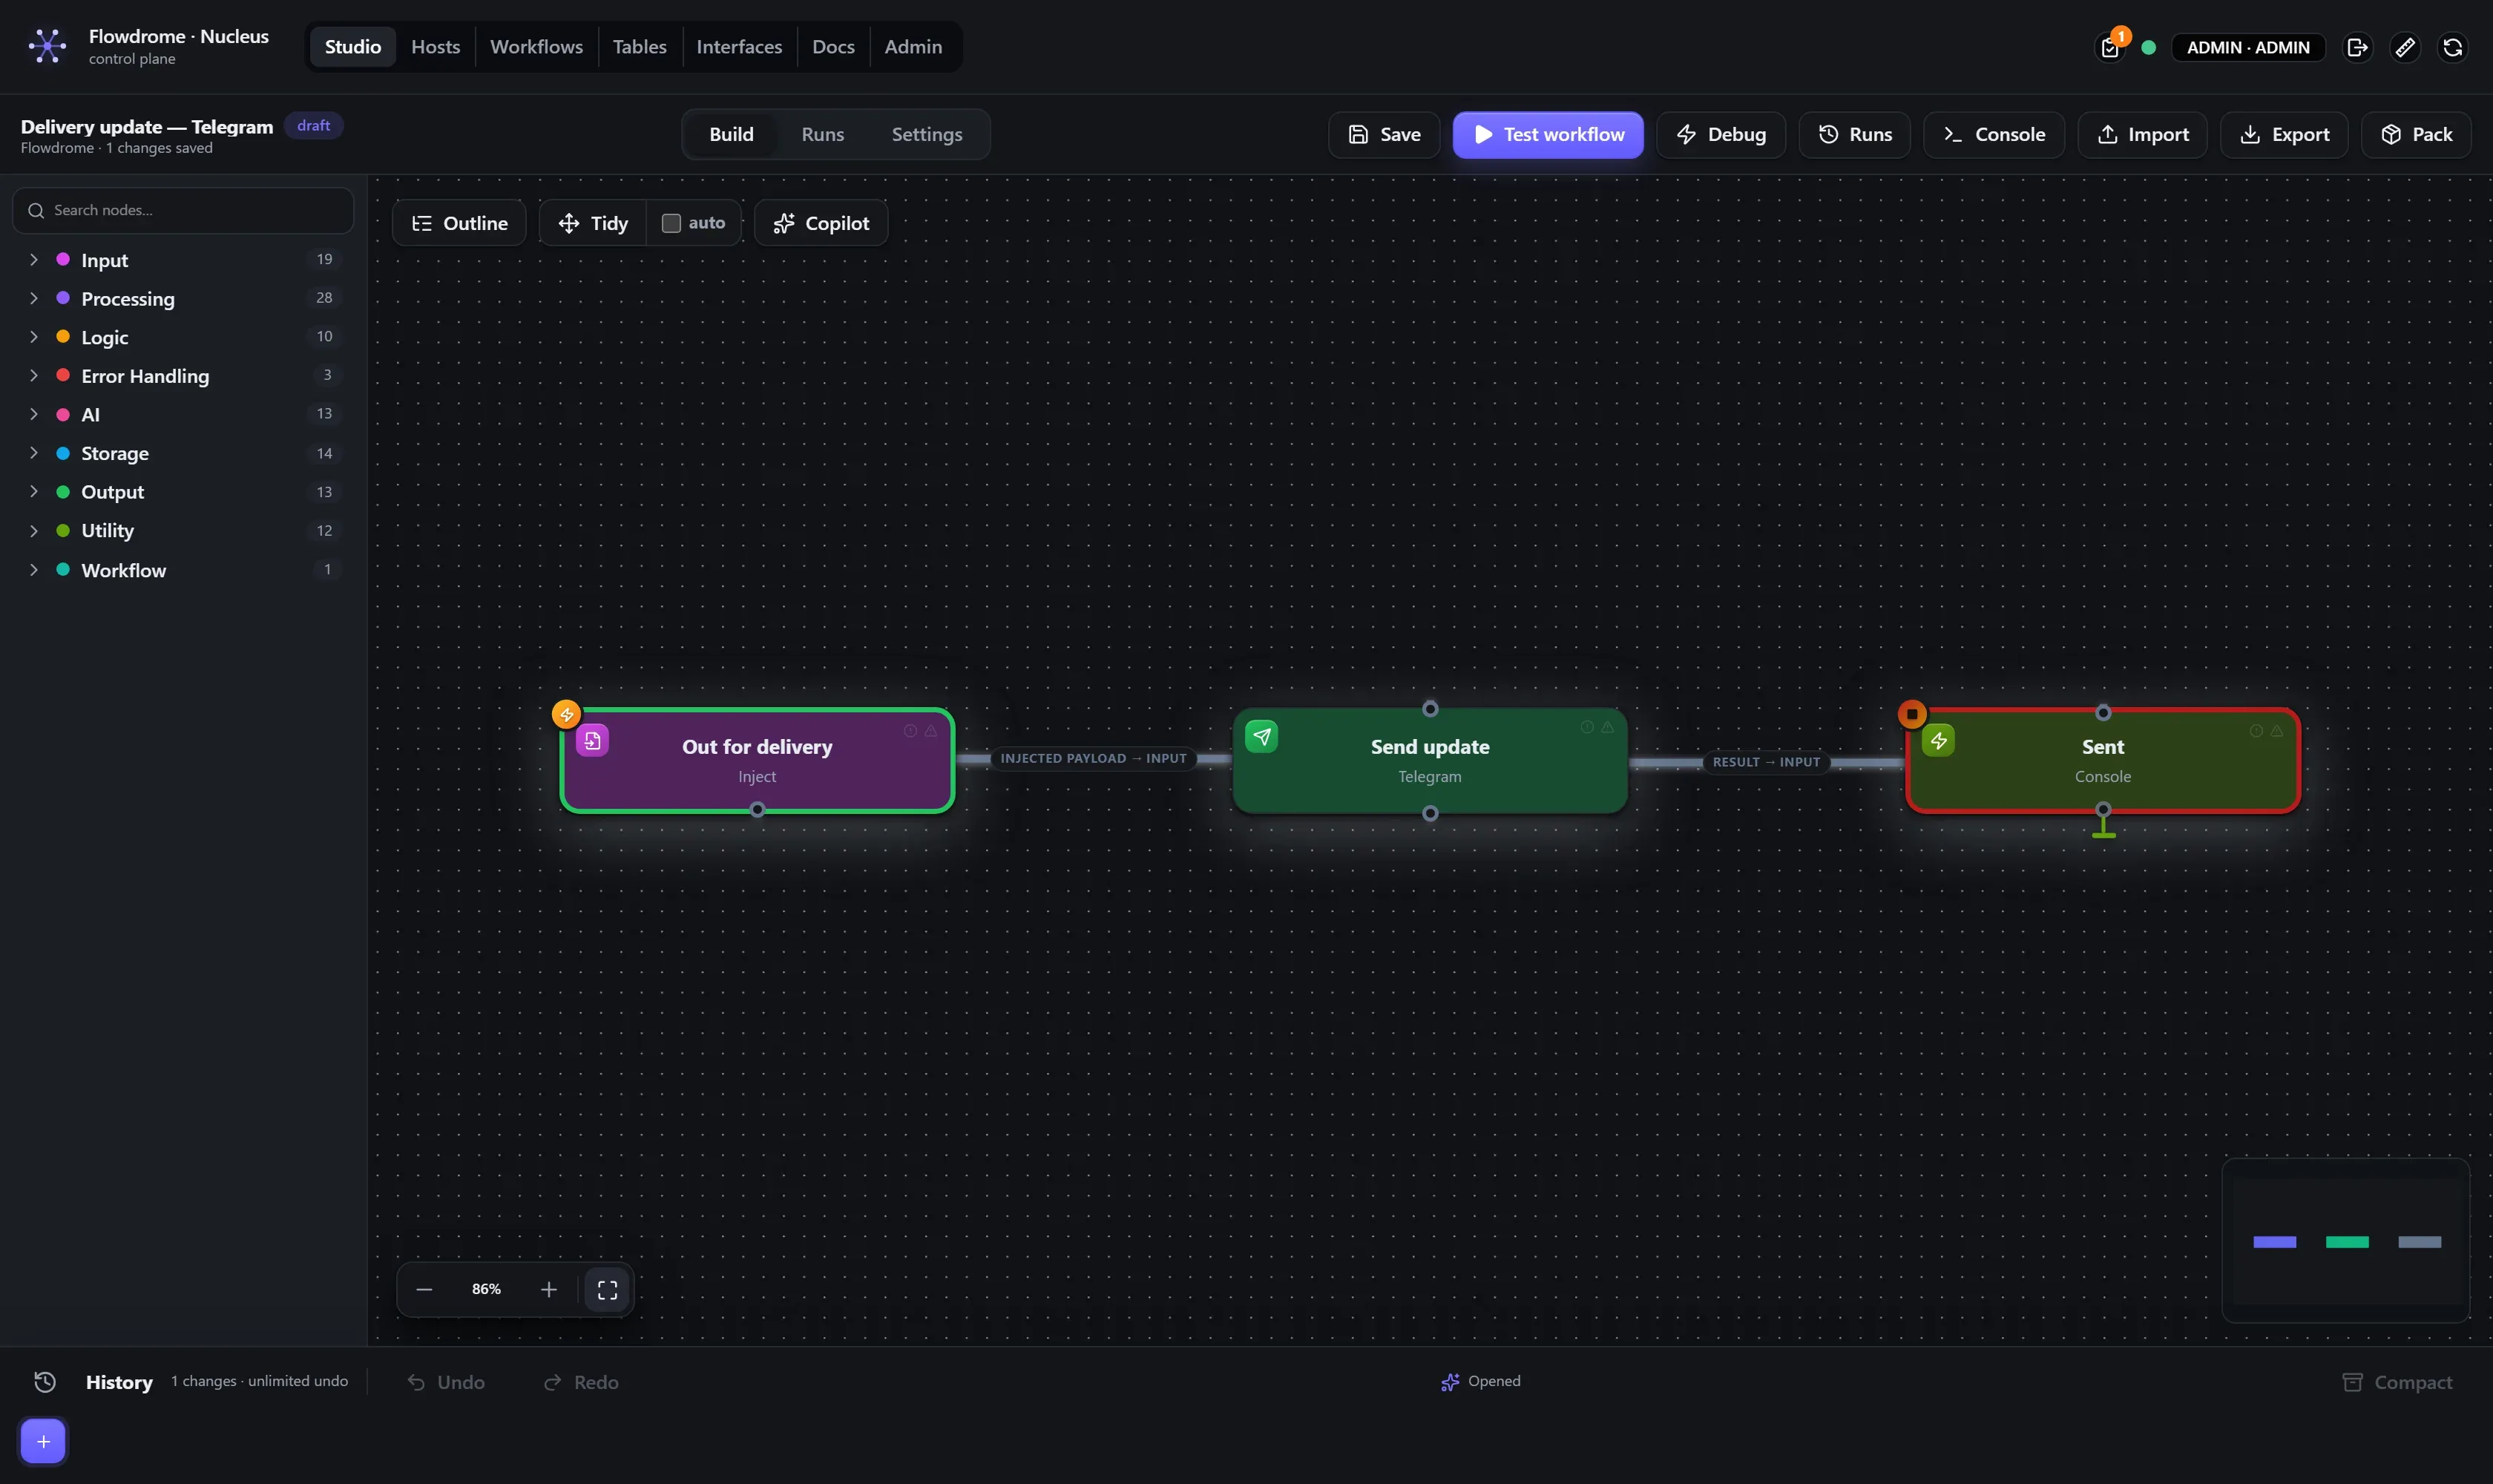
A quick map, clockwise from the top left:
- Workflow name + status chip —
draftuntil you deploy it; the line under it counts saved changes. - Build / Runs / Settings — Build is the canvas; Runs is this workflow’s run history; Settings holds the org-wide editor options (style, auto-layout engine, test-run retention — applied live for everyone).
- Save (Ctrl/Cmd+S), Test workflow, Playground, Debug, Runs, Console, Import, Export — the action row. There is no autosave: edits, drags and undo stay in your session until you Save, and the Save button carries a dot while anything is unsaved. Only Save mints a version — see version history for labels, pins, diff and rollback.
- The canvas — pan with the mouse, zoom with the wheel, fit with the zoom bar’s frame button. A dotted grid (configurable org-wide in the Builder’s Settings panel) helps line things up.
- Auto-layout (top-left of the canvas) — untangles the graph with one click. More below.
- History (bottom bar) — every change is an undo step; unlimited undo, with Undo/Redo buttons and a Compact action.
The node library
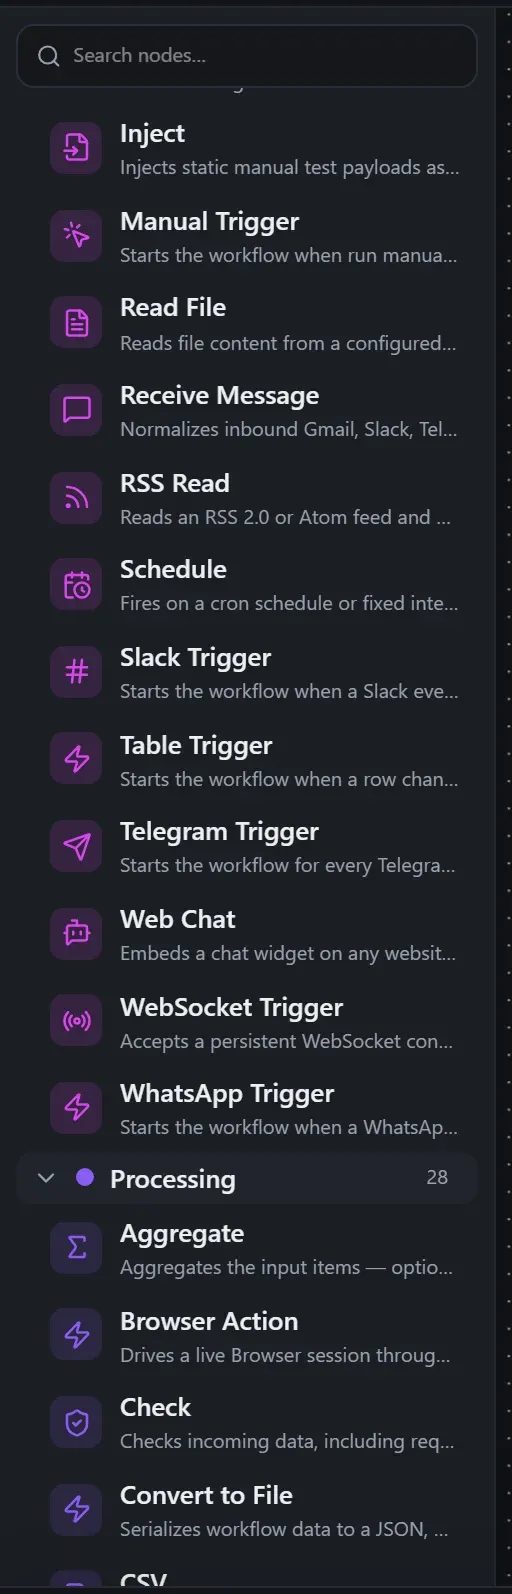
The left column is the catalog — every node, grouped into colored categories (Input, Processing, Logic, Error Handling, AI, Storage, Output, Utility, Workflow). Folders expand on click; the count chip shows how many nodes each holds.
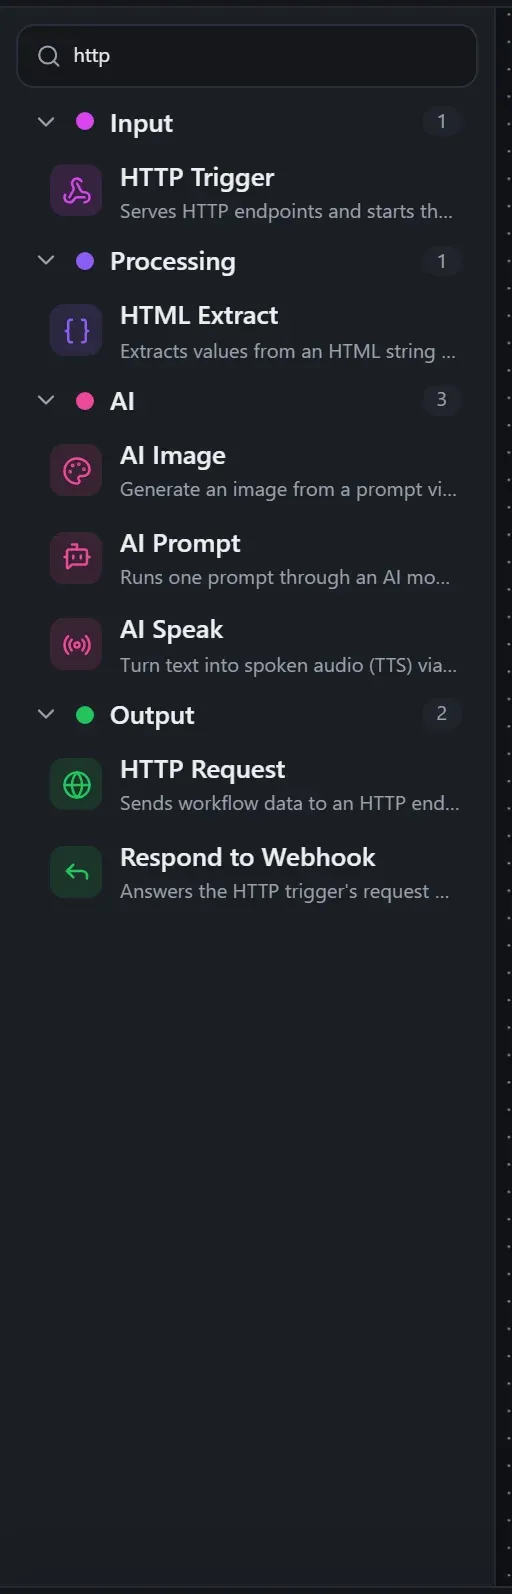
Typing in the search box filters live across names, descriptions and types, and force-expands every folder so matches are never hidden:
Adding and wiring nodes
Drag a node from the library onto the canvas (or just click it to drop it near the center).
To wire two steps, drag from a node’s output port (right edge) to another node’s
input pin (left edge). Ports are typed and labelled — IF has True/False, Try has
SUCCESS/ERROR/FINALLY — and the editor refuses connections that don’t make sense.
Node properties
A step’s settings are edited on the step. Below a node’s ports is a divider carrying a round chevron chip: click it and the node expands to show its settings; click it again to collapse. Only one node’s settings are open at a time — opening a second node closes the first — and they collapse when you select something else. A node type with no settings has no chevron.
Clicking a node selects it: it highlights, a delete button appears at its top-right corner, and (unless your org turns click-to-focus off in the Builder’s Settings panel) the canvas eases to ~150% with that node centred. Double-clicking a node opens its properties panel — the right-side dock with the step’s name, every setting, and its test/run data; while it’s open it follows your selection, and clicking empty canvas closes it and deselects. Renaming lives in the panel’s Name field. Double-clicking a wire lights up its complete path back to the start — every upstream node and connection that feeds it — and double-clicking it again (or clicking empty canvas) clears the trace.
The expanded settings carry the step’s Name, every property the node declares, and — on the nodes where per-item execution means anything (not triggers, not the Loop / Try / Thread Pool frames) — a Run once per item switch. Every node uses the same generic, typed property editor, with rich editors where they earn it (a cron builder for schedules, CodeMirror for JavaScript, the visual JSON editor for JSON fields, a structured rules editor for Switch).
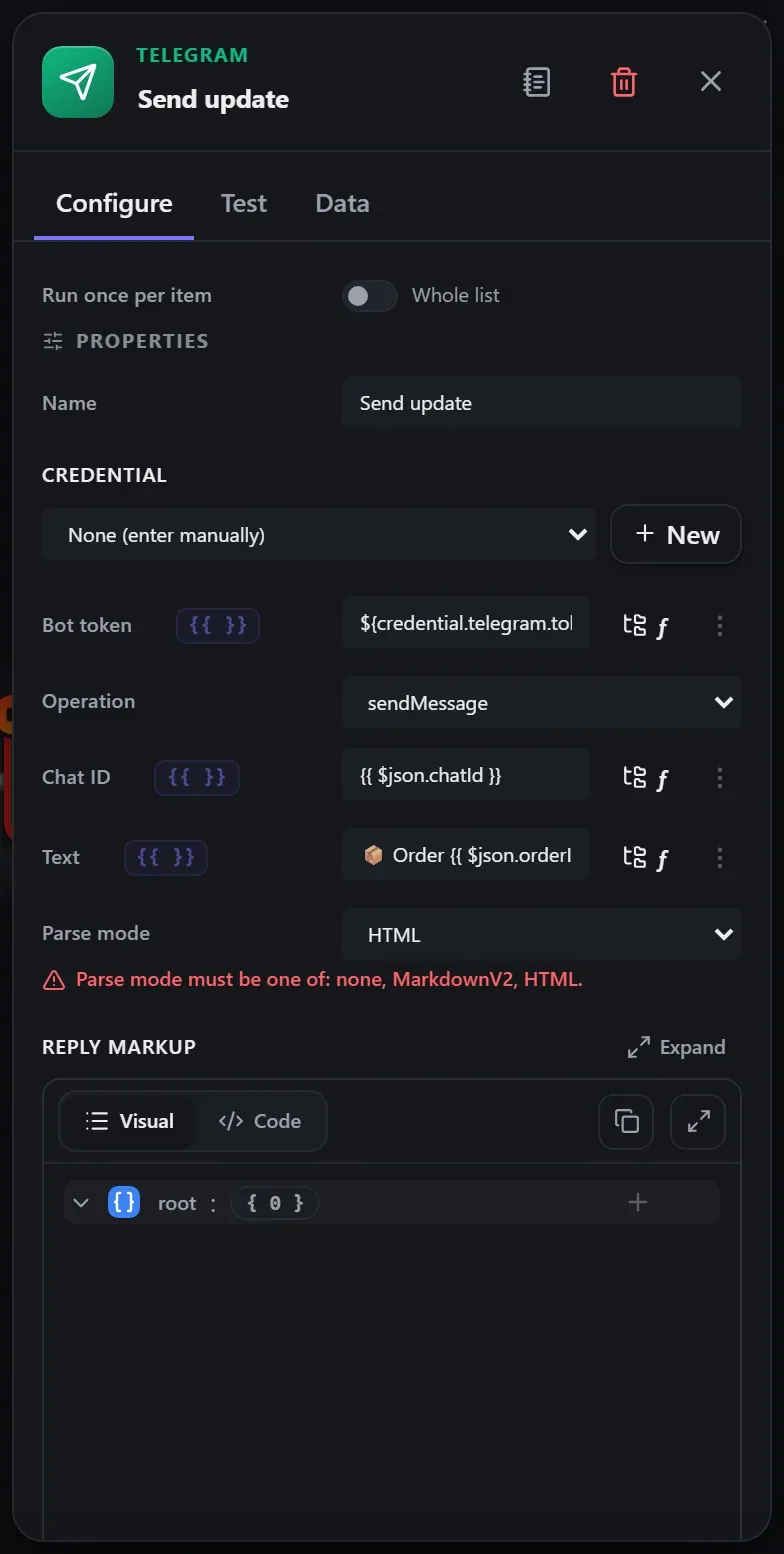
Four field behaviours worth knowing:
{{ }}expressions. Any plain string field accepts a{{ }}expression — real JavaScript over the incoming item, evaluated per item at the node boundary:Order {{ $json.orderId }} — {{ $json.items.length }} items. Expressions even descend into JSON that arrives as a string (an HTTP body, say) —{{ $json.body.results[0].name }}just works.- Credential picker. Connection-shaped nodes carry a credential dropdown; picking one fills
the secret fields with
${credential.name.field}references that resolve at run start. See Credentials. - Multi-selects and selects drive conditional visibility — properties appear and disappear based on other properties (the reference pages list every rule under “Shown when”).
- The ⋮ button. Every text-entry field carries a ⋮ on its right that pops the value into
the floating code editor — a full Monaco window (the VS Code editor) with a real language
service behind it: type-aware completions for JavaScript and C#,
$jsonfield completions typed from your live sample data,{{ }}expression snippets, and${variable.…}/${credential.…}reference inserts. A Format button runs Prettier for JS/JSON/HTML and a Roslyn formatter for C#; indentation is yours to pick (2/4/8 spaces or tabs), and a vim mode is one toggle away (:wsaves). Edits stream back into the field live.
Every node also carries validation badges (bottom-right of the node): a warning and an error icon that light up when the node’s verify rules find problems — a trigger with nothing connected, an invalid cron, unparseable JSON, empty code. Hover for the messages. You find out before you run, not after.
The AI Copilot
The toolbar’s Copilot button opens a chat window bound to the workflow on your canvas: ask what it does, tell it to make a change (“add a console between start and finish”, “change the url to …”), or open a blank workflow and describe what to build — edits land on the canvas immediately, with a live status line showing each tool the agent uses. It runs on your own model (local Ollama or a hosted provider) through the platform’s own MCP tools. Full guide →
Test workflow — run it for real
Test workflow executes the graph through the real runtime engine — real nodes, real HTTP, real envelopes — and paints the result onto the canvas: executed path highlighted, each node badged with its outcome, and a result pill at the bottom with the step count and total time.
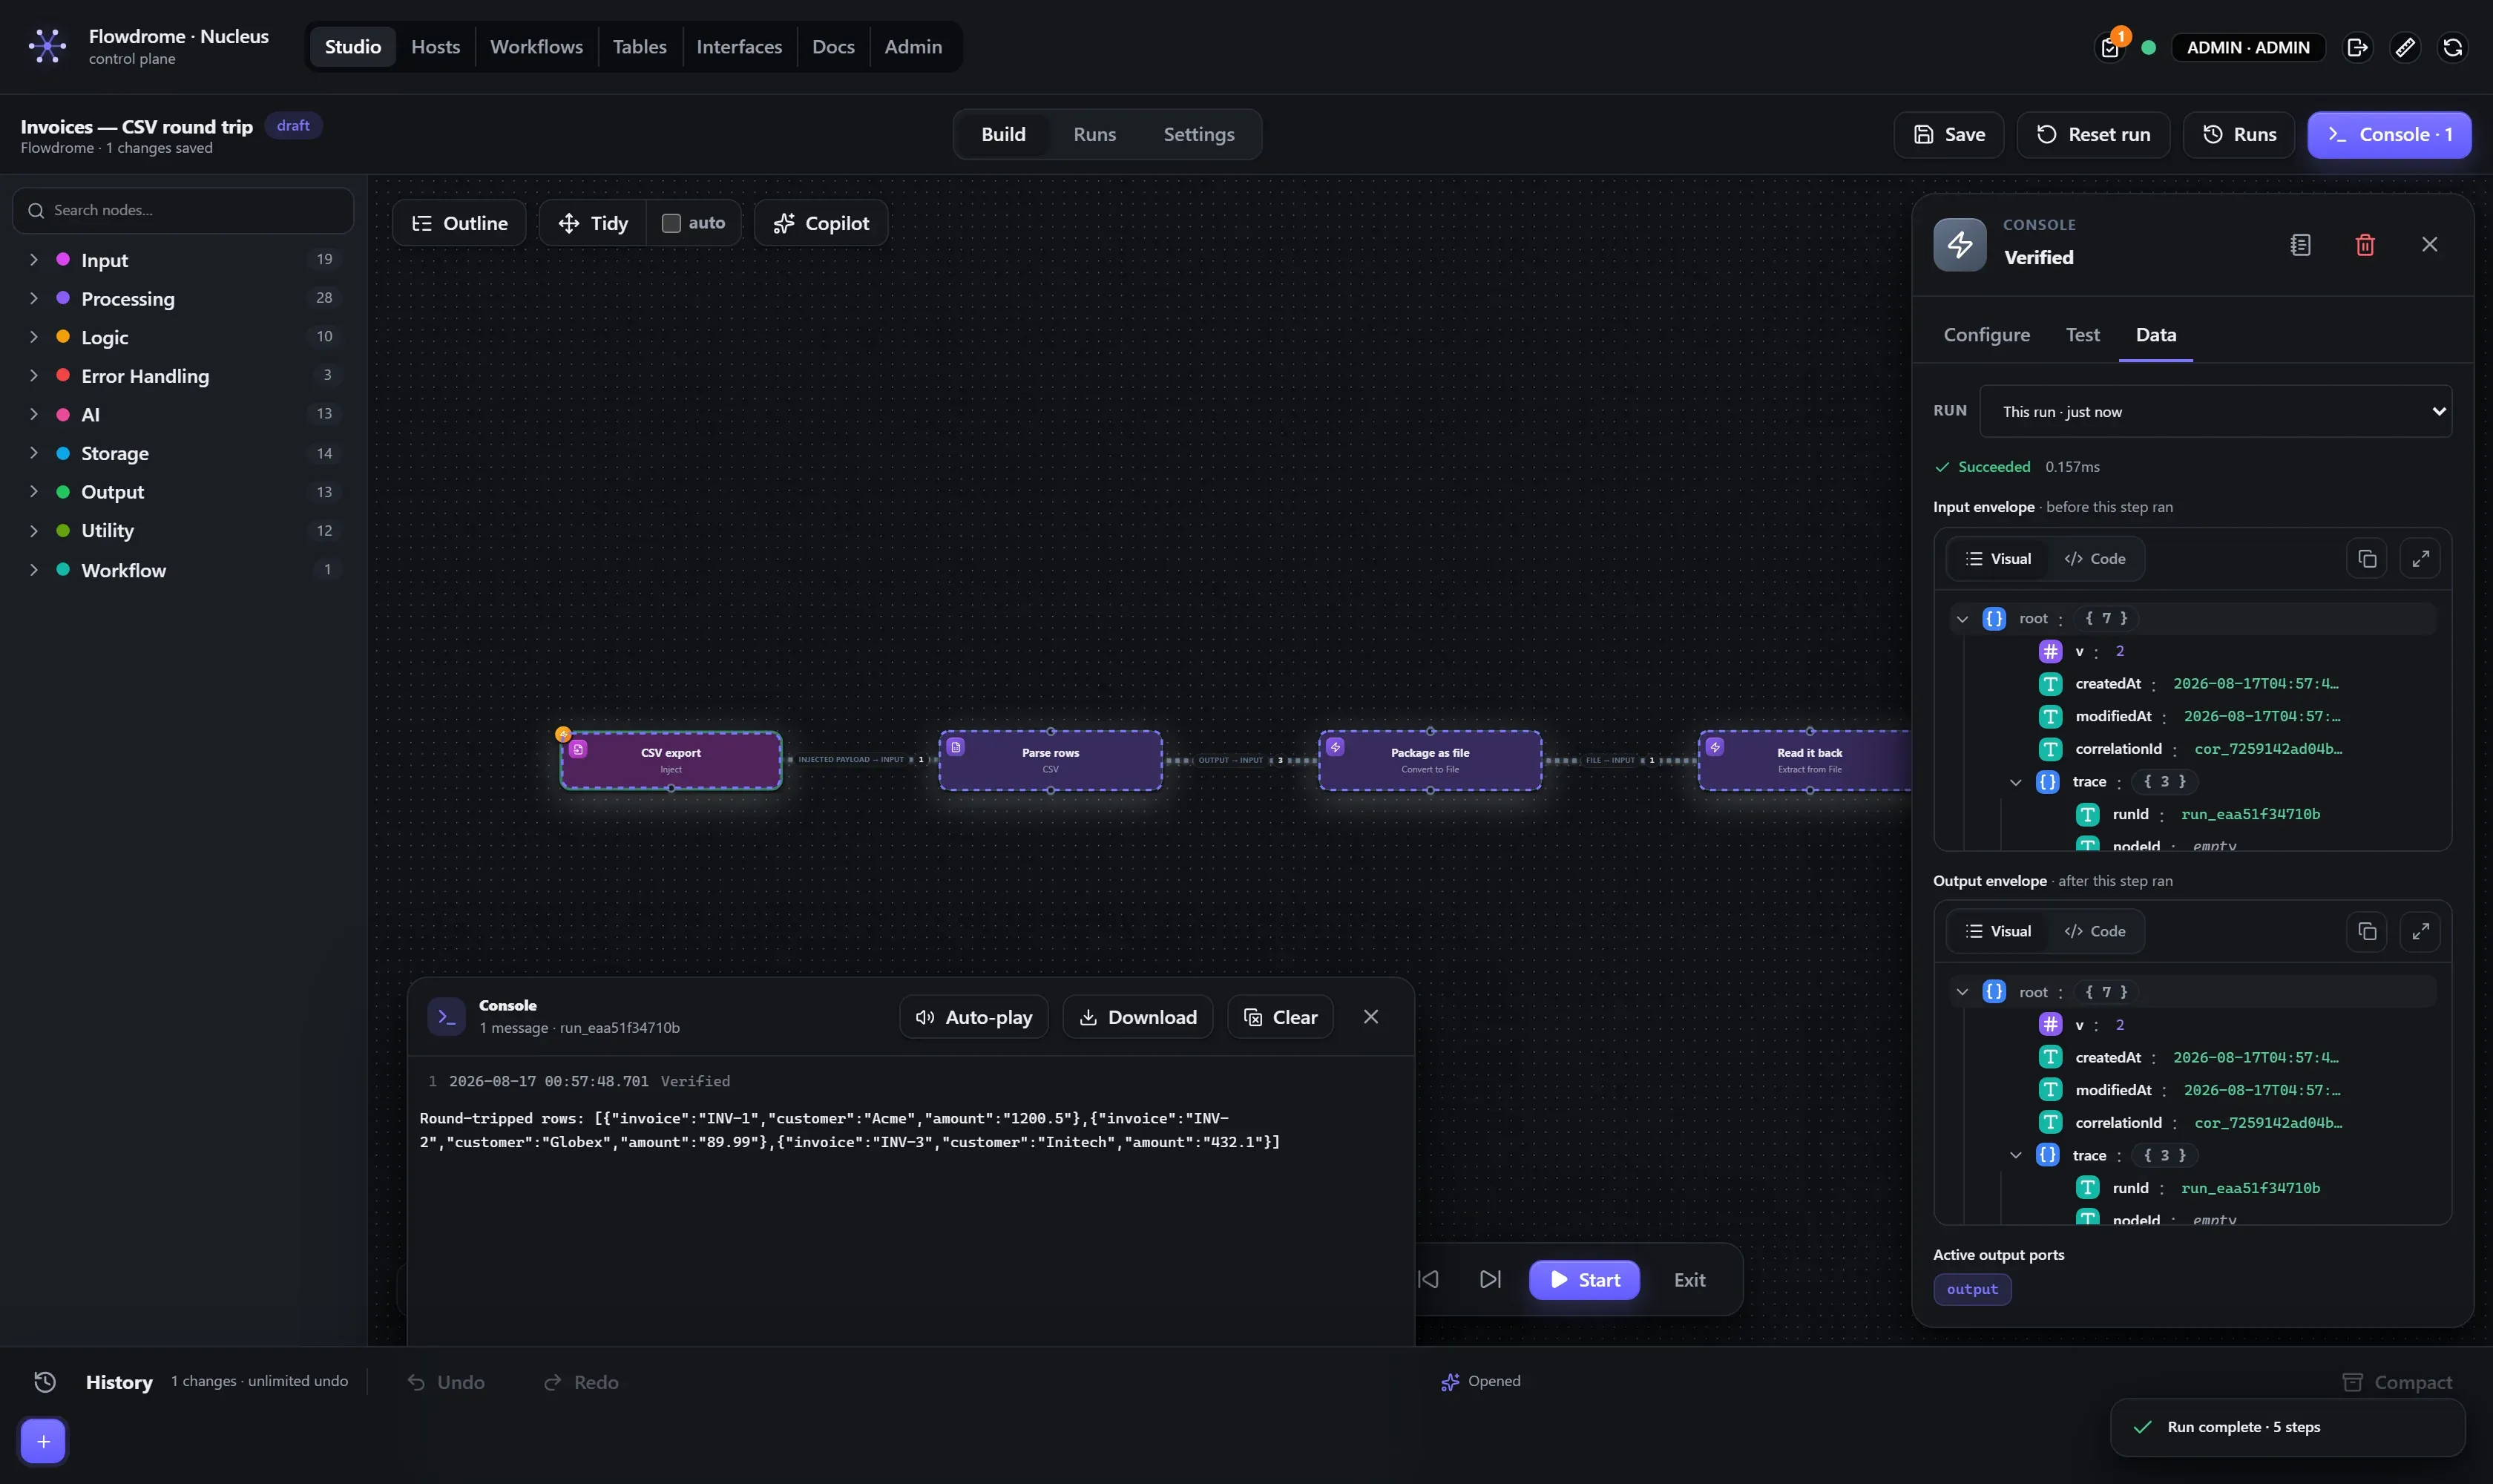
There is no slow playback animation — the result lands at once, on the final state. The pill’s Prev / Next arrows let you step back and forth through the executed order manually, revealing the path and the per-step outcomes one node at a time, which is the fast way to see how a long flow actually ran.
For conversational workflows there’s a second way to test: Playground opens an in-editor chat window where each message you type runs the saved workflow through the real engine (exactly the shape the Web Chat trigger delivers). The reply comes back as a chat bubble — with per-turn tool and guardrail chips and a hop trace — and the canvas lights up with the executed path, so testing a chat agent is just talking to it.
Reading run data
The toolbar’s Runs button opens a floating Recent runs window — drag its header, resize
its corner — with three columns: this workflow’s test and debug runs, the steps of the run you
pick, and that step’s two envelope viewers, Input envelope (before the step ran) and
Output envelope (after). The Runs tab shows the same per-step envelopes in a full-screen
layout. Flowdrome always shows the whole envelope — v, timestamps, correlationId, trace,
and body with the payload inside — so what you debug is exactly what travelled the wire.
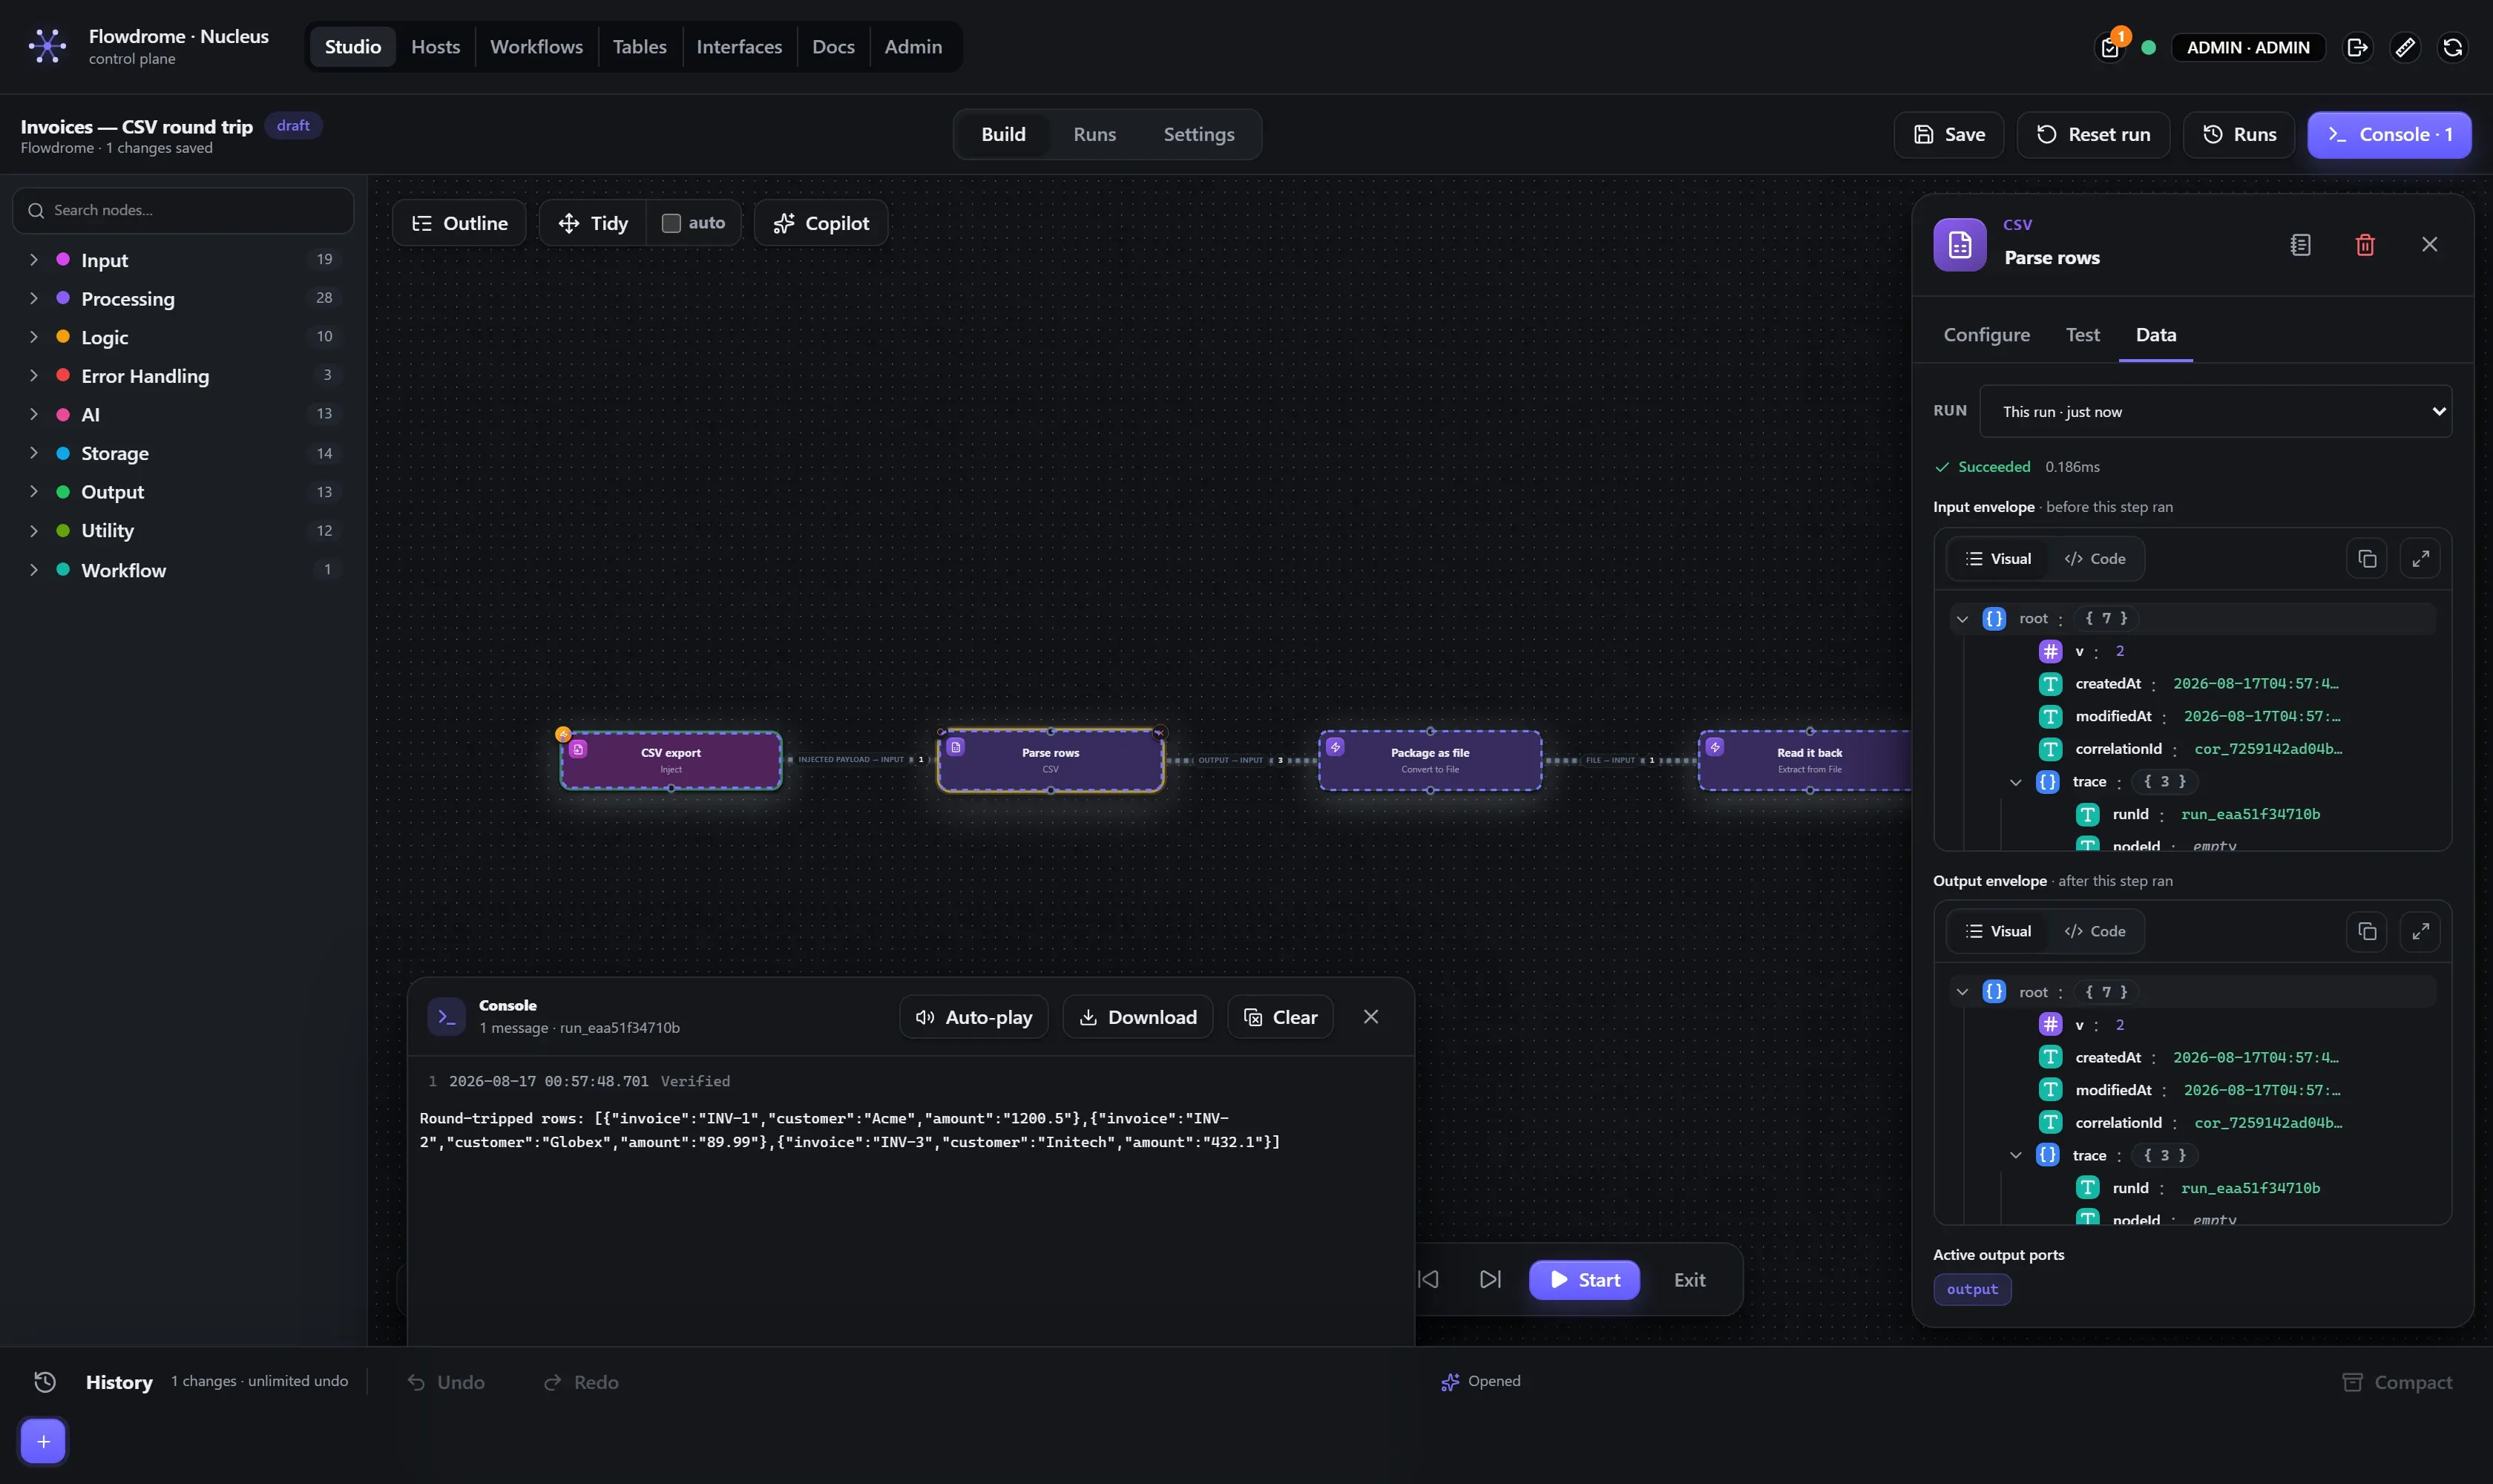
The tree view is the same visual JSON editor used everywhere in Flowdrome: type badges per
value, expandable containers, a Code tab for raw text, and — crucially — right-click → Copy
Flowdrome path, which puts the correct {{ }} expression for that field on your clipboard.
Huge payloads don’t hurt: a node that emitted 100,000 rows ships a small preview to the browser, and the viewer lazy-loads more rows as you ask for them.
The Console dock is the run’s narration: Console nodes print timestamped messages, Show Image renders pictures inline, and Play Audio embeds an auto-playing audio player — live during Test/Debug (the dock opens itself on the first entry), listed in the Runs tab, and saved with the run. See the Console for the model.
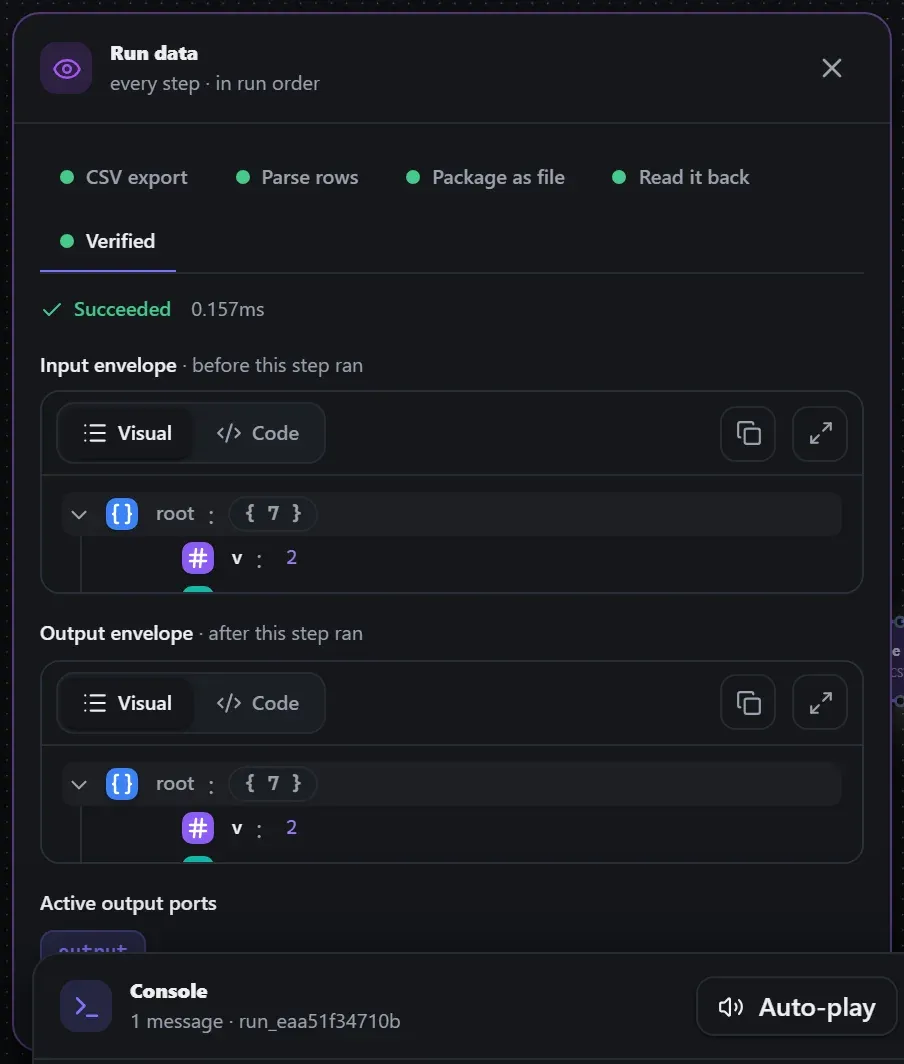
The purple Run data floating panel appears when the flow contains Visualize
(utility.inspect) nodes — each one is a watchpoint whose captured envelope shows up there,
tabbed per node:
Debug — pause on the wire
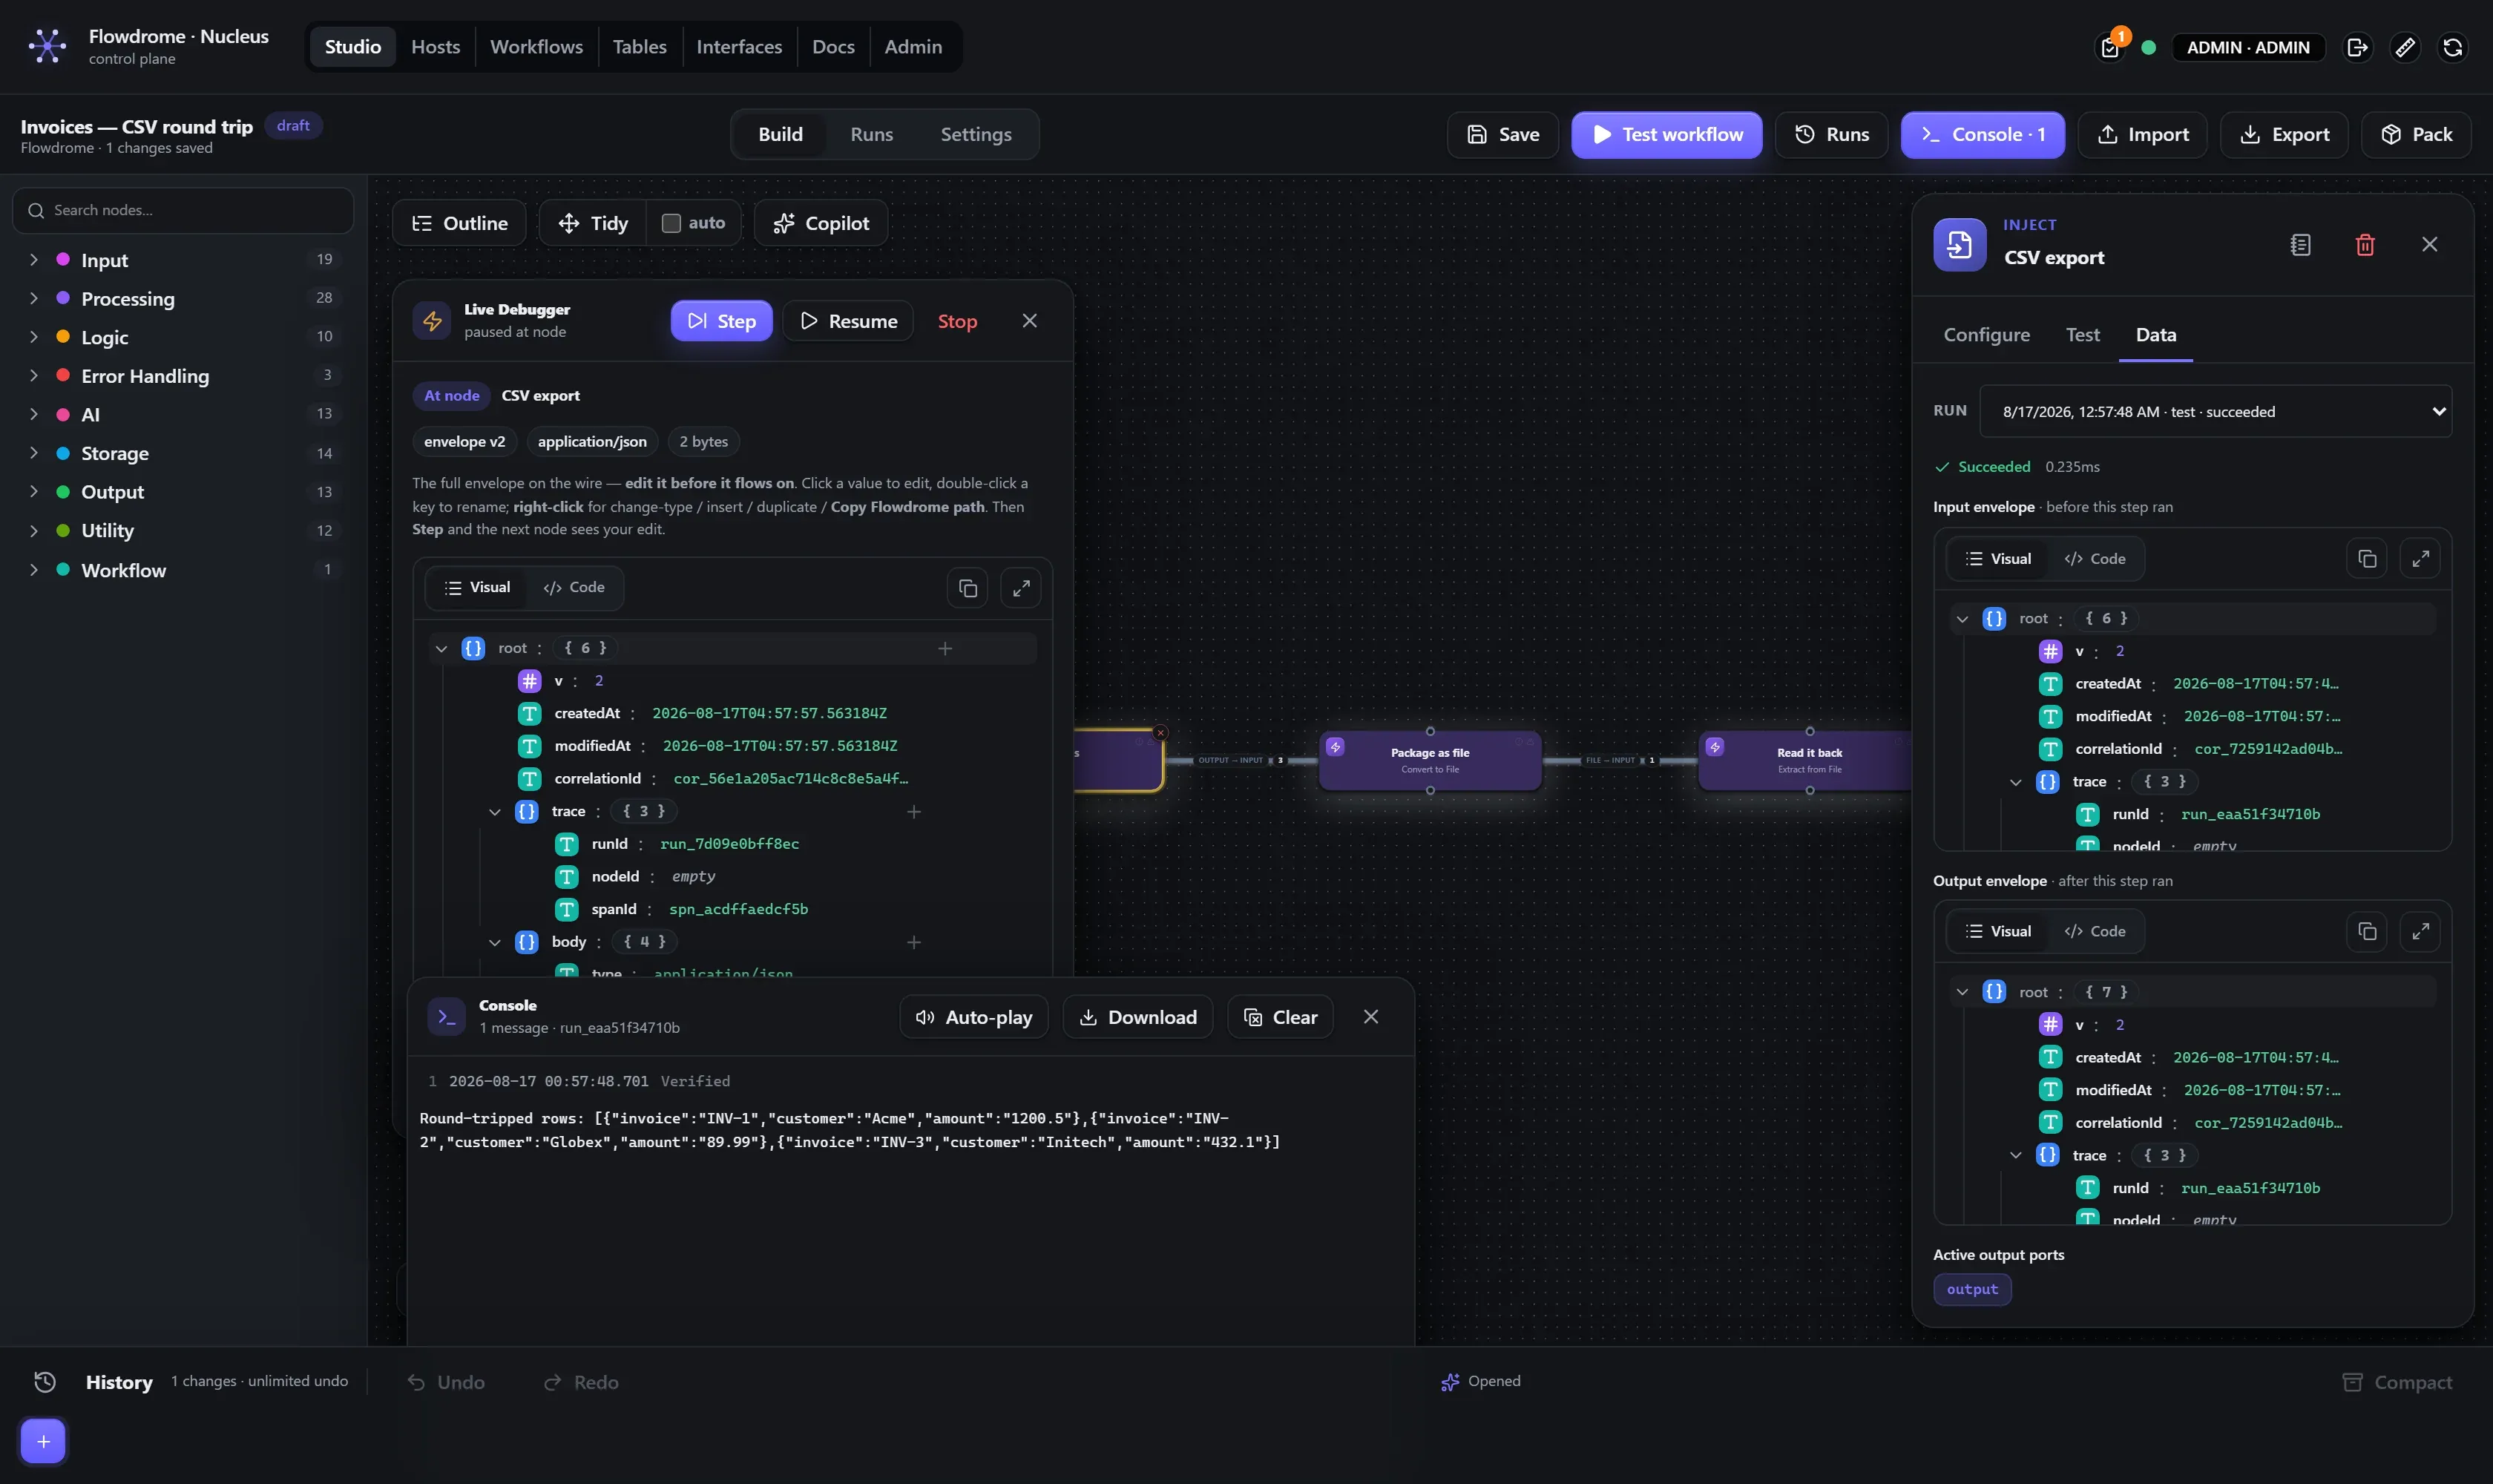
Debug runs the same engine in stepping mode: the run pauses at every node and on every link, showing the full envelope at that exact point — and you can edit the data on the wire before letting it continue. Step, Resume, or Stop from the panel; you can even edit the parked node’s configuration and step into it with the new config.
The Runs tab
Build / Runs / Settings — the Runs tab lists every test run and debug session of this workflow, newest first, with status, step counts and durations. Selecting a run shows its trace: every node with its status and timing, the slowest steps card (the bottleneck, flagged), and the same input/output envelope viewer per node — including a per-port selector for multi-input nodes like Merge.
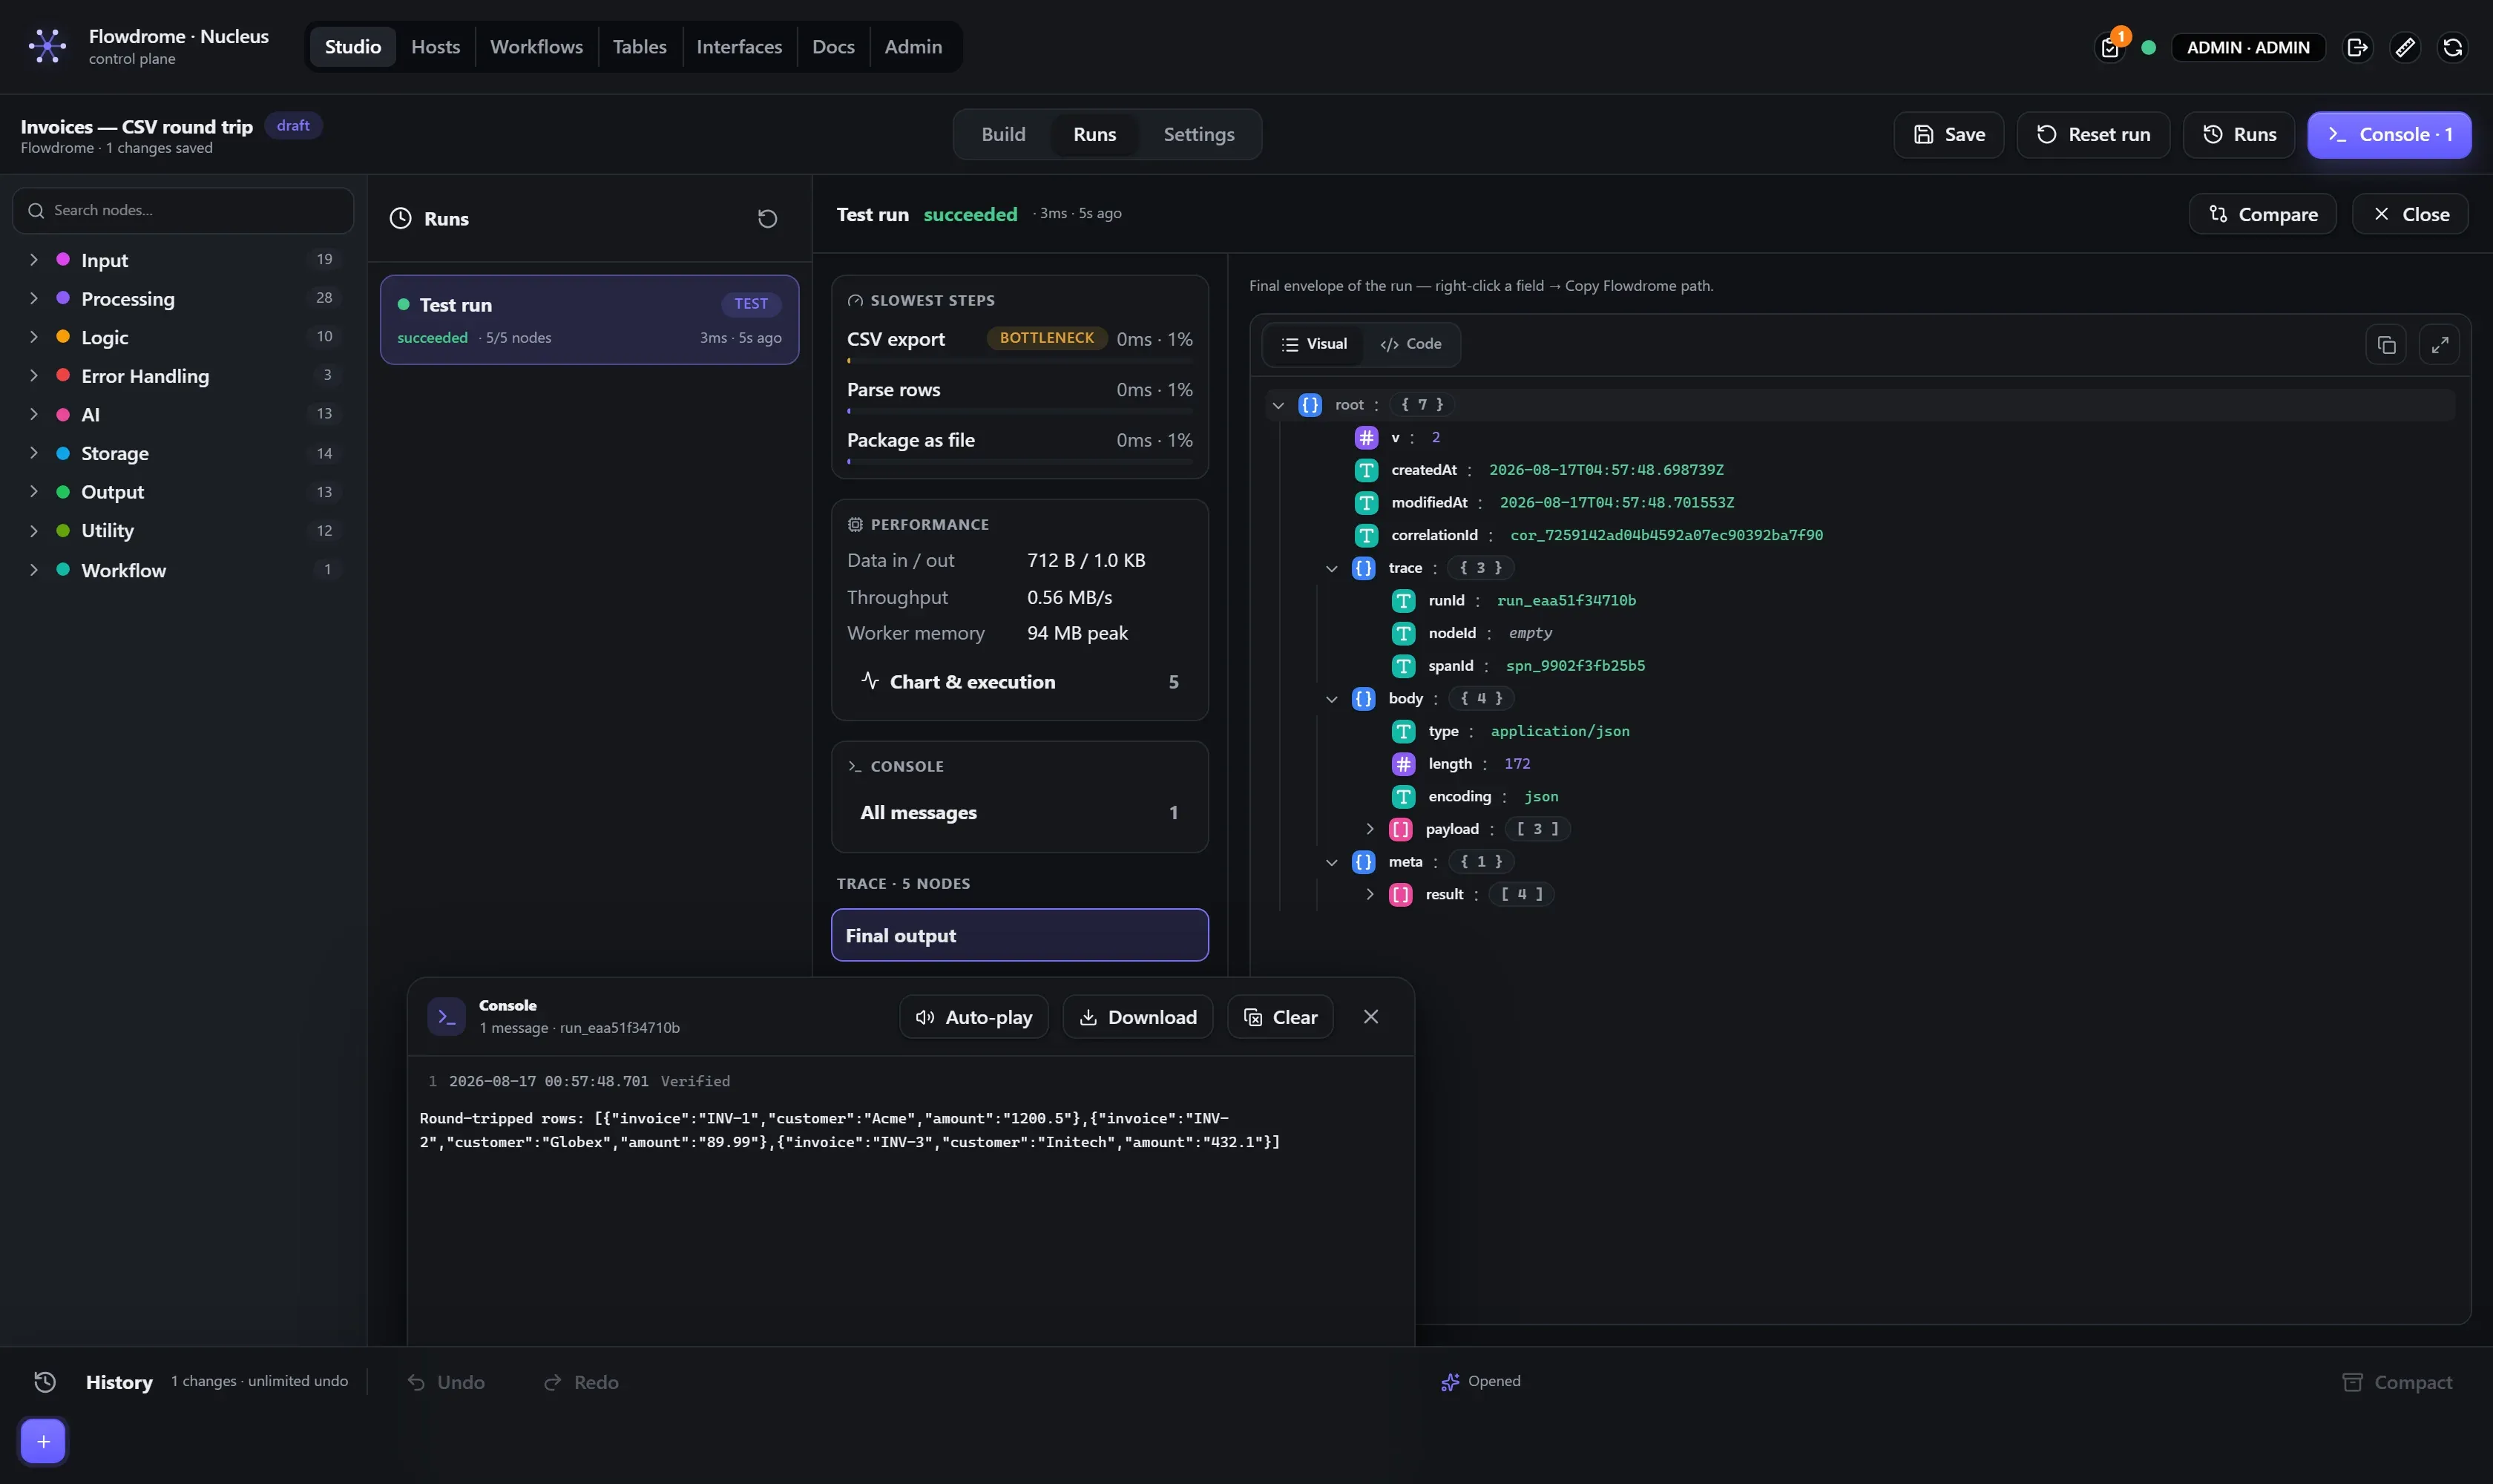
Three power features live here:
- Retry from a node. A failed run’s detail offers Retry from step — it re-runs from the failed node, seeded with the inputs recorded in that run. Upstream steps are not re-executed: no webhook re-fired, no email re-sent.
- Compare. Pick any two envelopes — across runs — and diff them field by field, full envelope or payload-only, with JSON-in-strings parsed so HTTP bodies diff at field level.
- Stop. A long test run can be cancelled from the toolbar; it lands as a clean canceled run, not a failure.
Import / Export
Export downloads the workflow as a JSON file — the graph plus captured run metadata, in
the same flowdrome.workflow.v1 format everything else uses. Import accepts such a file and
restores both. What you export is exactly what deploys; there are no converters between editor
and runtime formats.
Frames: Try, Loop, Thread Pool, and Snippets
Four things on the canvas are frames — labelled containers you drop nodes into:
- Try — an error boundary. Members run normally; if one throws it is retried per the
frame’s policy, and the failure leaves on the frame’s
ERRORport instead of failing the run. (SUCCESSandFINALLYcomplete the set.) - Loop Over Items — members run per batch over a list, with batch size and concurrency
settings, collected on the frame’s
doneport. - Thread Pool — queue-fed concurrency: consume from an input queue, run the body on an elastic worker pool, feed an output queue.
- Snippet — a purely visual grouping frame (find it in the library’s Workflow folder) for labelling regions of a big graph. The engine ignores it.
Drag a node into a frame to make it a member — membership is containment, and it survives save/reload because it’s part of the document. The Try and Loop reference pages show captures of both frames in action.
Next
- The Workflows screen — folders, history, deployments.
- Credentials — secrets without pasting secrets.
- Your first workflow — a guided build, end to end.