Runs & run data
Every test run records, for every executed node, the entire data envelope that crossed each wire — not a truncated preview, not just the payload. When you debug, you are looking at exactly what the engine saw. This page explains what’s captured, where it lives, and the tools built on top of it.
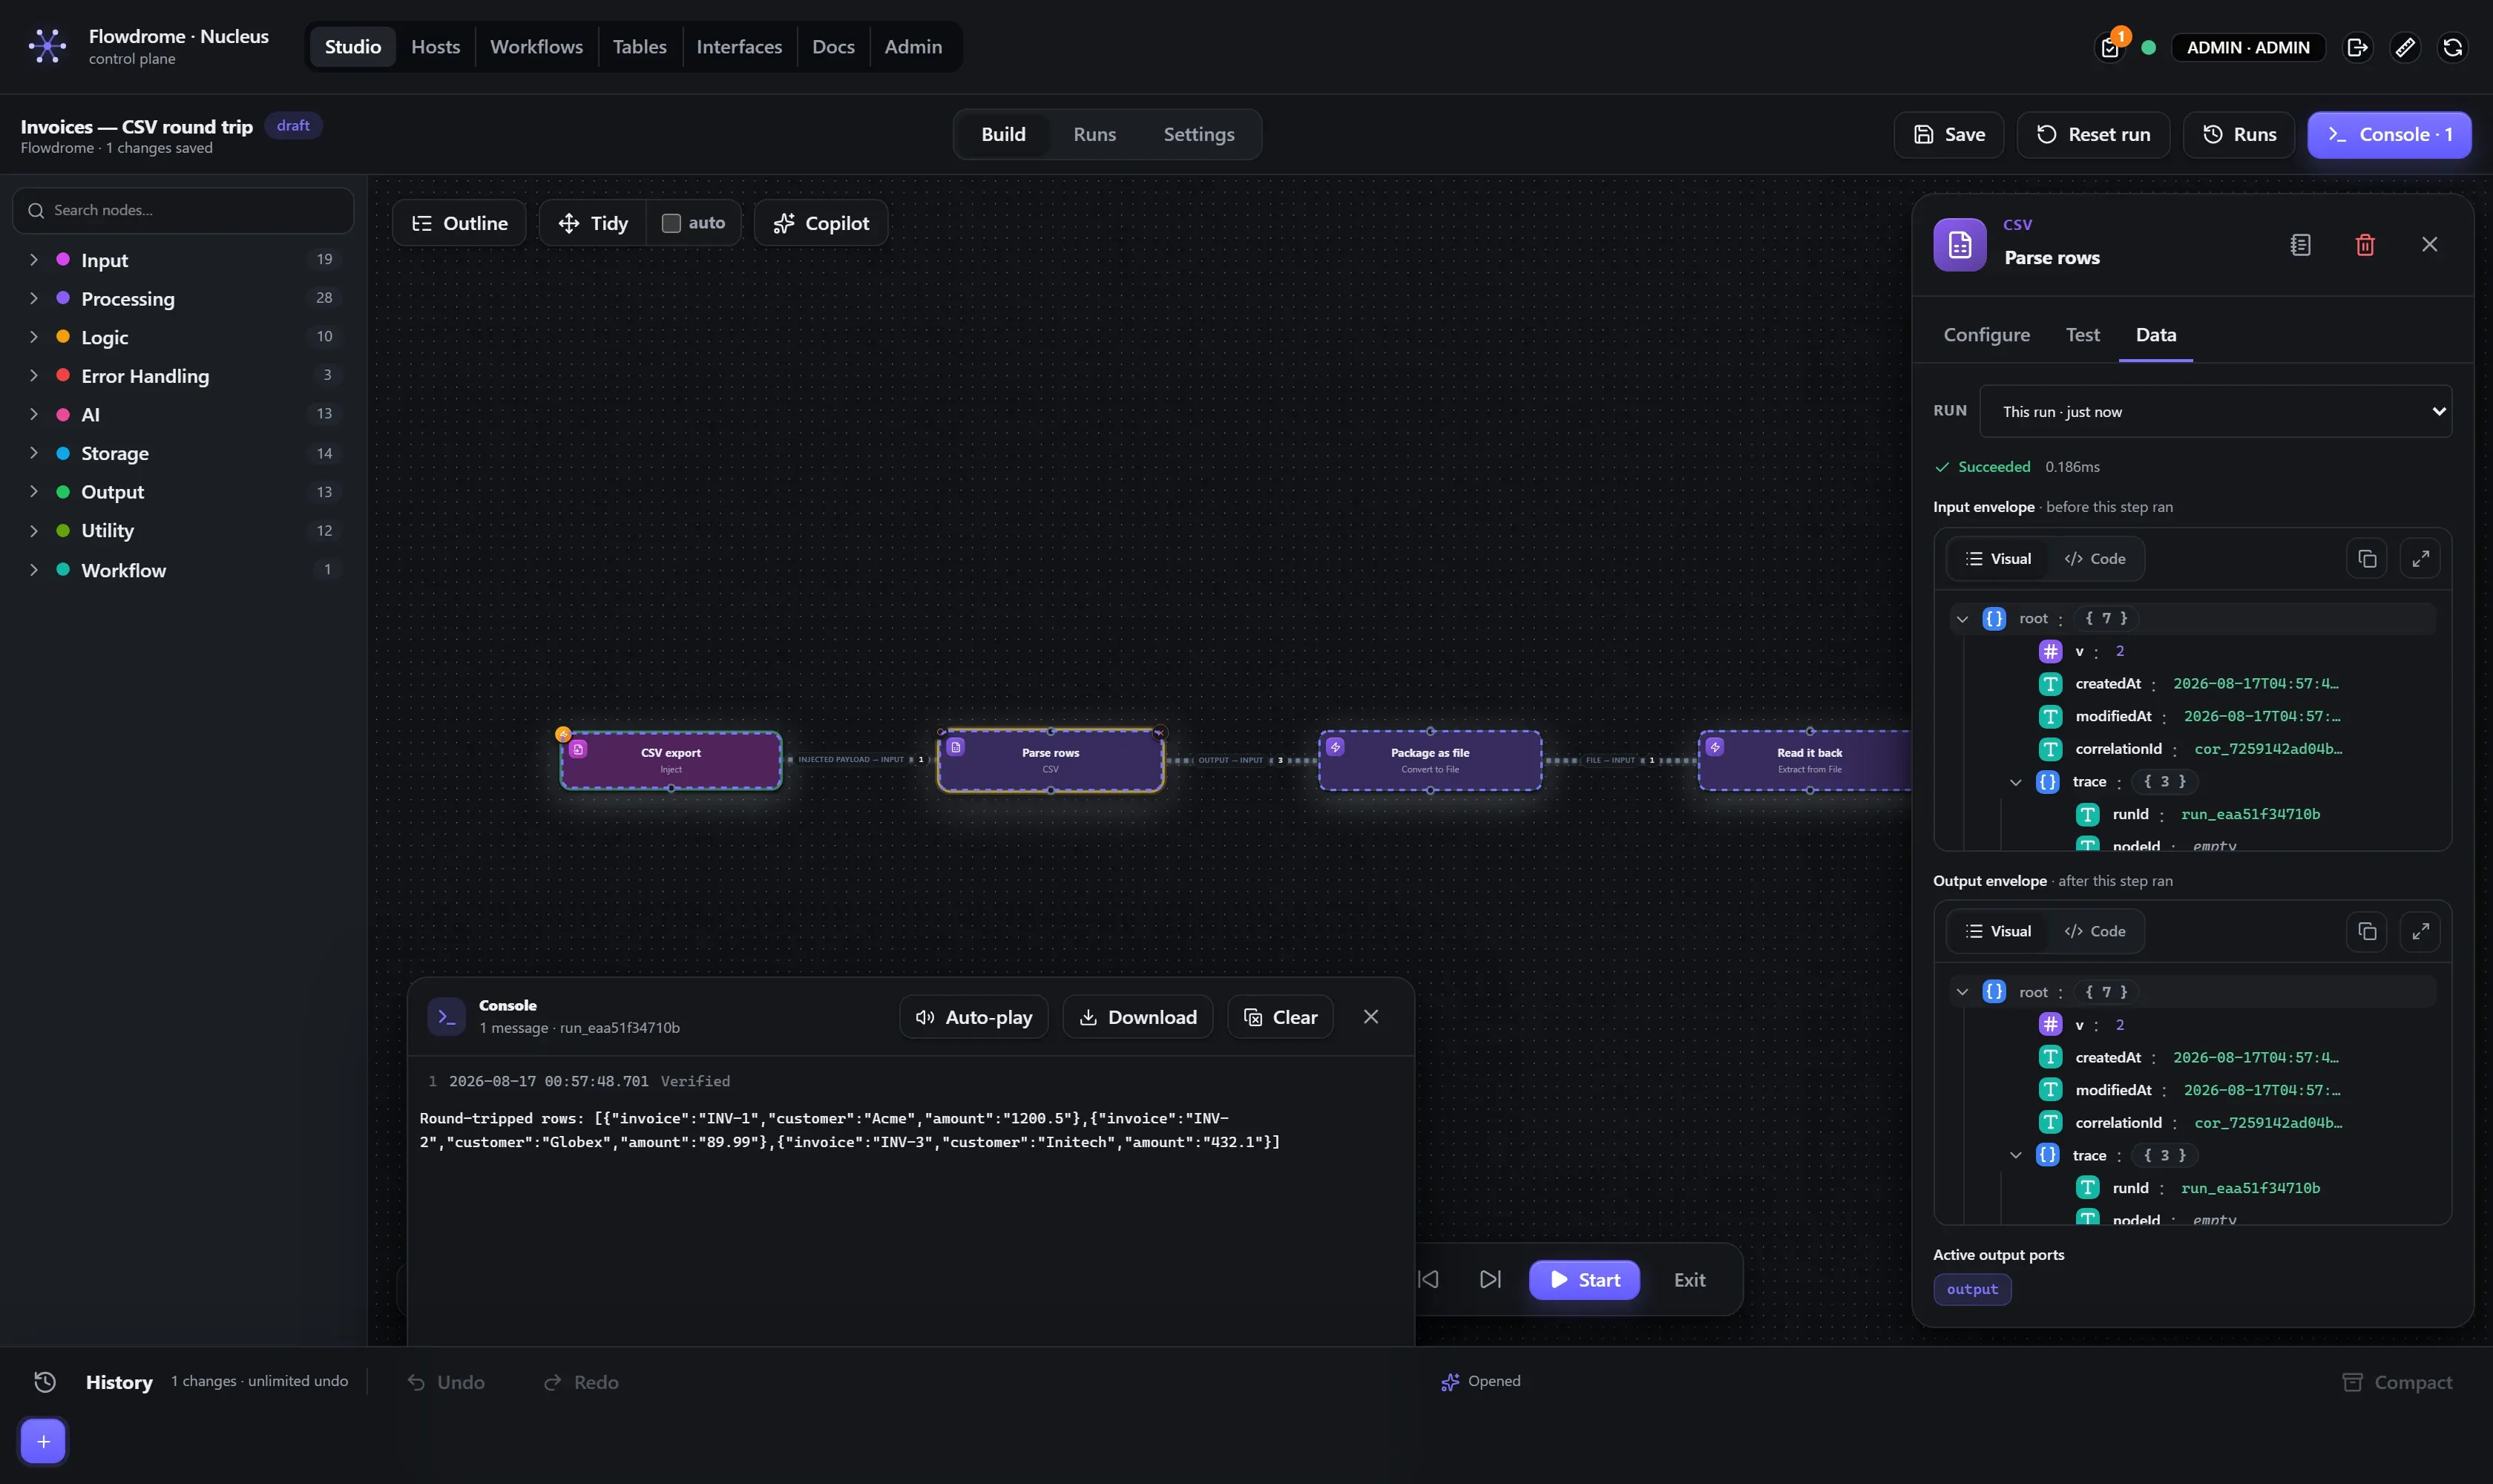
The envelope
Data between nodes travels in an envelope: the working payload plus its content type and length, creation/modification timestamps, a correlation id, and the trace (run id, node id, span). Surfaces that display run data show the whole thing — it’s a hard product rule — because the metadata is exactly what you need when something’s wrong: which run, when did the payload change, what content type did that service actually return.
Why this matters day to day:
- Field paths come from reality. Right-click any field in the viewer → Copy Flowdrome path → paste the expression into a node property. No guessing at shapes from API docs.
- JSON inside strings expands. An HTTP response body that arrives as a JSON string
renders as an expandable tree (a
{} JSONpill marks it) — you inspect it, and expressions can descend into it, without a parse step. - Binary is first-class. Files and images flow as binary items with metadata, not base64 blobs mangled into JSON.
Per-port capture
Multi-input nodes record each input port separately. A Merge node’s run view has an All inputs / Input 1 / Input 2 selector, so “what exactly arrived on the second input?” has a first-class answer — which is the question you’re actually asking when a join misbehaves.
Warnings and counts
A run that succeeded is not the same as a run that did what you meant — the expensive failures are green runs carrying the wrong data. Three things a run reports at a glance, before you open a single envelope.
meta.warnings — the runtime warning channel. Any node may attach meta.warnings (a list of
strings) to its result: it ran, it succeeded, but the data wasn’t the shape it expects and the
engine can name the problem. Split Out flags a field that
isn’t an array and points at the one nearby that is — expected an array at “rss.channel” but got
an object — did you mean “rss.channel.item” (array of 10)? — and separately reports how many
items had no value at that field at all. Table flags a column whose
mapping resolved to nothing, and keys that aren’t columns of that table at all (the store drops
those silently; the node catches it by diffing what it sent against the row that came back). A
Loop Over Items frame handed something that isn’t a list says so.
Output-contract violations recorded at warn level are mirrored into the same list. Messages are
deduplicated and capped at 25 per node; under Run once per item each item’s warnings are
collected onto the batch, so one bad row in a thousand still gets named exactly once.
Warnings render amber — guidance, not failure — in three places: a badge with a count on the node itself on the canvas (hover for the messages; it stays there as last run), a chip in the Loop frame’s title bar (frames carry no node badge), and a list above the envelopes in that step’s run-data panel. They are part of the run record, so they’re still there when you reopen the run.
Per-wire item counts. Every wire carries a chip with the number of items that flowed on it:
an array payload → its length, a single object or scalar → 1, nothing → 0. Only a succeeded
source makes a claim (running, skipped or failed → no chip), and a port the source never fired
reads 0 rather than a phantom count. Zero renders amber — the “nothing came out of here” cue
that otherwise costs an envelope-by-envelope hunt. Sampled big-array bodies (see below) report
their real row count, not the preview’s. The chips are always on: they read the same layered
source the data pickers use — persisted run history, this session’s Test run, then a live Debug
session on top — so they survive leaving test mode and a page reload, and refresh the moment a
newer run lands.
Record counters. A list arriving at a storage node is N records: one operation per record,
one result per record, with packages/runtime-core/src/nodes/per-record.ts owning that loop so
every record-writing node behaves identically. The run says so in numbers — a fanned-out step’s
meta carries records (results produced) and in (records received), and its output envelope
holds the array of N results in order. A single object in gives a single result, un-wrapped, with
no counters; an empty list writes nothing and returns [] with records: 0, so “no data” never
reads as “one blank record”. Feeding a step ten items and feeding it one item ten times (the
Run once per item toggle) produce the same rows.
The contract covers storage.table, storage.redis, storage.s3, storage.global-key-value,
storage.memory (append only — set/clear hold one value per key), storage.notion,
storage.hubspot, storage.google-drive, storage.google-docs, storage.write-file and
storage.ftp, plus ai.vector-store, which now embeds one metadata object per record so
metadata-filtered retrieval can tell the vectors apart. storage.sql, storage.mongo and
storage.google-sheets stay whole-set deliberately: Mongo’s insertMany and the Sheets append
are already single batch calls, and a per-record SQL node would have to make its query and
parameters expression-eligible — re-opening the value-splicing that typing them as SQL and JSON
closes off. The messaging senders stay whole-set too; they’re rate-limited per channel, so one
message with N lines is usually the right answer.
Write File is the one place fan-out is decided by the path,
because N writes aimed at one path make one file, not N. A literal path is a single write for the
whole batch; a path that varies per record (a {{ }} template, or a path read off each record)
is one file per record — and meta then reports files, paths and bytesWritten, keeping
path for the case where the batch landed in a single file. Two records resolving to the same
file with append off fails the node with IO_WRITE_PATH_COLLISION before a byte is written,
rather than overwriting nine records with the tenth; with append on they’re joined in order and
the run carries a warning naming which records shared the file.
Big data stays fast
Large node payloads (hundreds of rows, tens of kilobytes and up) are captured in full but shipped deferred: the run view receives a small descriptor (row count, byte size, a preview) and fetches windows of rows on demand as you scroll. A 100,000-item run opens in milliseconds; the data is still all there, server-side. The same windowing protects the live debugger and the host dashboard’s run drawer (“Load full data”).
The Console
Runs also carry a console feed — a timestamped stream that renders in a floating dock during Test/Debug (it opens itself on the first entry) and lands in the Runs tab, saved with the run. Three nodes feed it:
- Console prints a message (with
{{ }}expressions) — theprintfof workflow debugging. - Show Image renders a binary image — an AI Image result, a downloaded file — inline in the feed, live during the run and preserved in the run record.
- Play Audio embeds an inline audio player for binary audio (an AI Speak reply, a file); new entries auto-play during a Test/Debug run, with a mute toggle in the dock header.
Retention & archived runs
Three layers, from hot to durable:
- The test host keeps a configurable number of recent runs in memory (Admin → Test host → retention; default 25). Beyond that, run summaries remain listed but the details are evicted — such rows render dimmed.
- Summaries are durable: they’re persisted to the Nucleus’s embedded database and survive restarts.
- Saving a workflow embeds its recent runs in the document (
meta.runs). Reopen the workflow months later — or on another Nucleus after an import — and those runs appear with an ARCHIVED chip, fully openable. Your reference run travels with the workflow.
Comparing runs
Runs → Compare diffs any two envelopes — within one run or across runs (every recent run’s envelopes are offered, grouped per run). Added/removed/changed highlighting, an only-differences toggle, and a scope switch: Full envelope (default — timestamps and trace included) or Payload only. JSON held in strings is parsed for field-level diffs, so two HTTP responses diff by body field, not as two giant strings.
Typical uses: “what did this step change?” (its input vs its output — the default picks), and “why did today’s run differ from yesterday’s?” (same node, two runs).
Performance, in detail
The Runs tab’s Performance card rolls the whole run up: payload bytes in/out across every node boundary, throughput (MB/s and items/s where nodes processed item lists), and the peak worker memory observed. Next to it, slowest steps names the bottleneck.
Those byte totals are a deliberately approximate measure — a structural estimate that runs a
few percent high, used because measuring them exactly meant serialising every payload twice on
every node, which cost several times more than transporting the data. They are sized for
proportion and trend (“which step moves the data”), not for billing to the byte. The envelope’s
own length field is the exact figure where one is needed.
Below the totals sit phase timings: nodes that do expensive multi-step work report where
the time went — the SQL node splits connect (socket + TLS + auth) from query, the HTTP
nodes time the request itself. Phases show as chips on the Performance card (summed across
the run) and on each node’s duration tooltip, and they ride the
telemetry stream to your log platform. So “the SQL node took 900ms”
becomes “870ms of it was connection setup — pool or move the database”.
Retry from a node
A failed (or merely suspicious) run can be retried from any node: Flowdrome rebuilds the downstream subgraph and seeds it with the run’s recorded input envelopes at that node — then runs it as a brand-new run of the same workflow. Upstream is not re-executed: no webhook re-fired, no email re-sent, no API double-billed. The data you already captured is the fixture.
The Runs view surfaces this as a Retry from step button on failed runs; together with the slowest steps card (top three by duration, the worst flagged as the bottleneck) it makes the Runs tab the place where both correctness and performance questions get answered.
On the hosts
Deployed apps keep their own run history with the same envelope model (capture budgets are configurable per app — see the host’s Settings tab). The host aggregates a run ledger across its apps: start/end records the host itself preserves in its embedded database, so an app’s operational history survives the app rotating its own records (“preserved by host” rows in the dashboard). App logs stream to the host and through the Nucleus’s logs drawer; per-app CPU/memory/disk telemetry lives in the host’s Resources tab with selectable history ranges. See the Hosts guide for captures of all of it.